UX Design Case Study Management
UI/UX / Dashboard
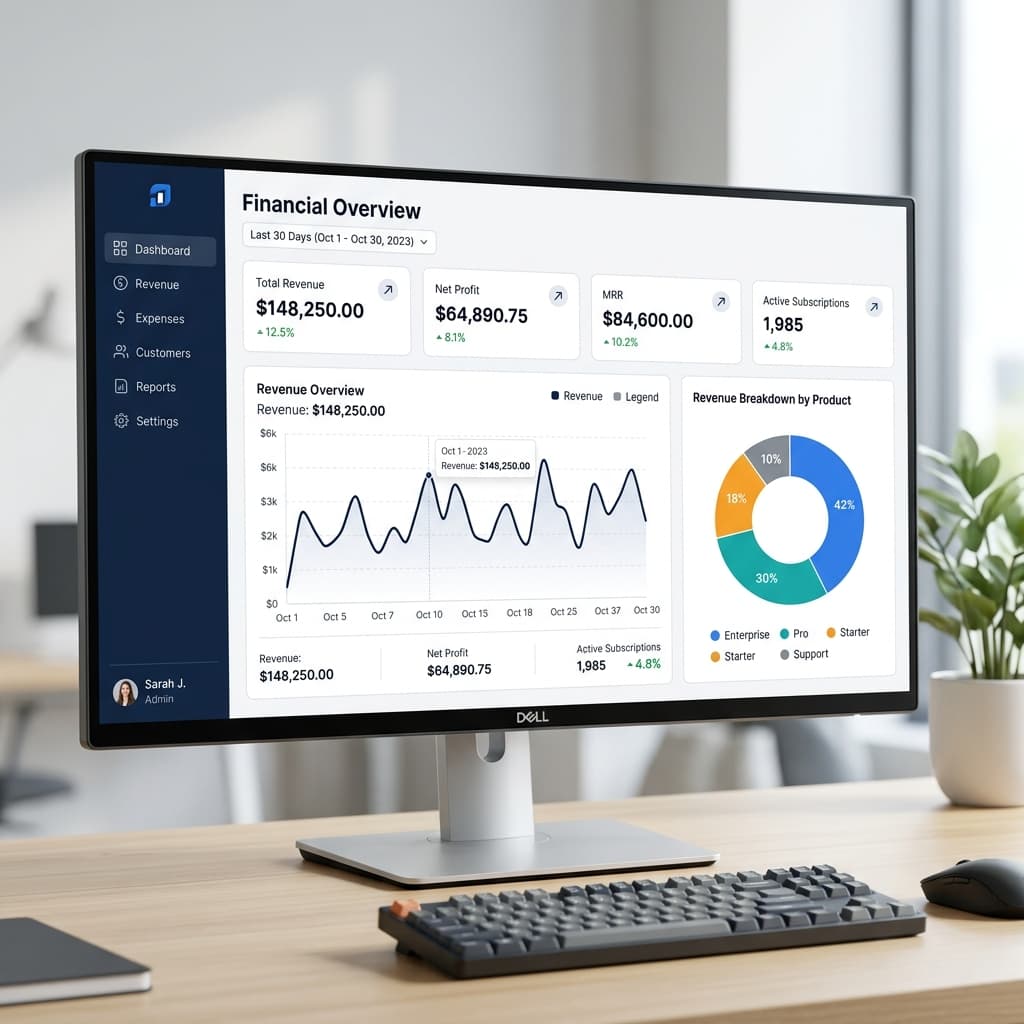
UX Design Case Study Management
A comprehensive SaaS analytics dashboard engineered for high data density, visual hierarchy, and sub-second chart responsiveness. Empowers executives to monitor revenue streams, subscriber churn, and active customer LTV in real time.
Research & User Insights
- Data Architecture: Optimized SVG chart rendering for multi-thousand data point series.
- Color System: High-contrast financial palette with dark and light theme adaptability.
- Custom Modular Cards: Drag-and-drop widget layout personalized per executive role.
Problem Statement
- Legacy reporting tools suffered from 5+ second query latency and cluttered charts.
- Inability to generate instant custom executive PDF reports during quarterly reviews.
Final Outcome & Impact
- Sub-second page load times and real-time WebSocket chart updates.
- 98% satisfaction rating from executive test cohorts.
- Saved finance teams an estimated 15 hours per week in manual spreadsheet exports.
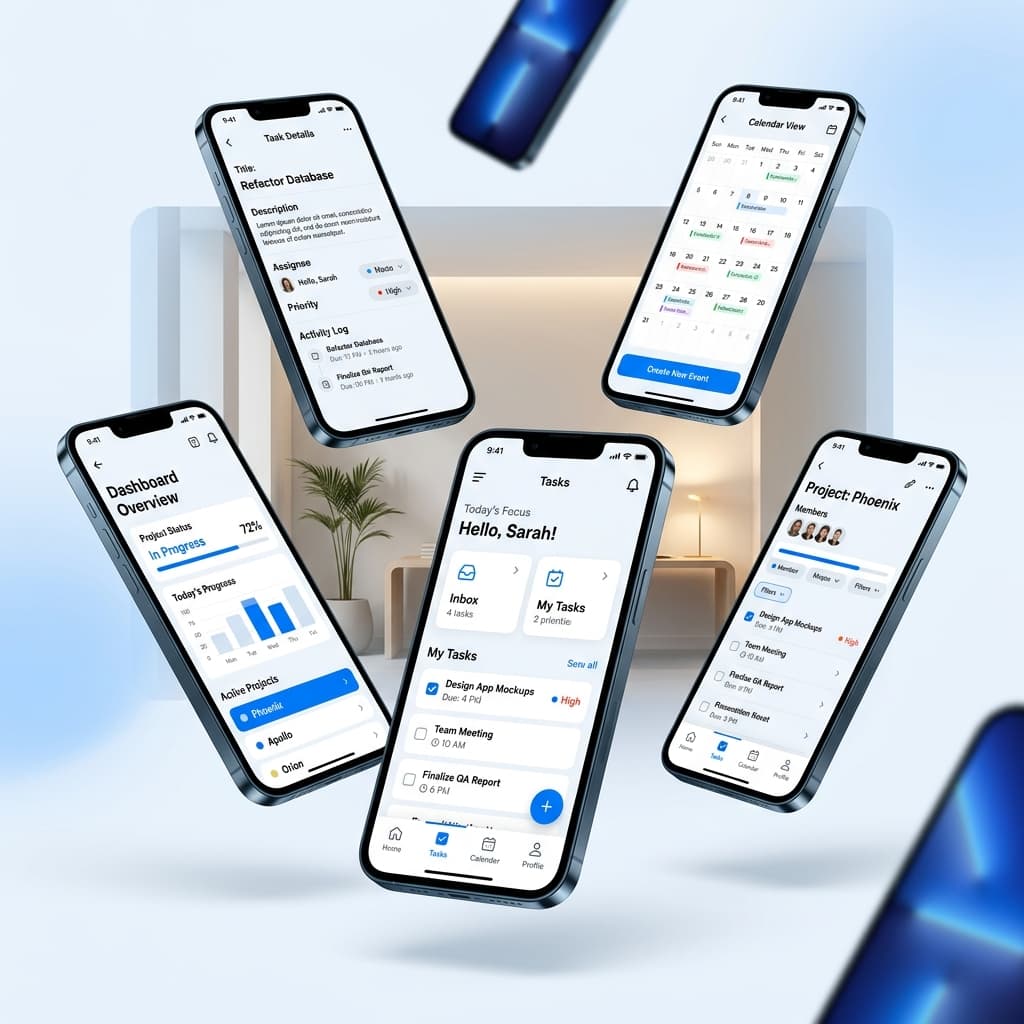
At F2B Systems, we believe great design is more than just visuals — it’s an immersive, high-converting digital experience. We build robust, scalable applications tailored precisely to your operational goals.
Project Information
Project Name:FinAnalytics Platform
Client:Apex Financial Group
Technology:Next.js, Recharts, Tailwind CSS
Cost:$15,000 - $20,000
Date:10 February, 2026
Don't Hesitate To Contact Me
+252 63 3155315